![]()
Develop and use allometric equations relating to the size and structure of urban trees. Refer to package website and prototype web app for demonstrations of how the package may be used. The package supplements the following study:
Song, X. P., Lai, H. R., Wijedasa, L. S., Tan, P. Y., Edwards, P. J., & Richards, D. R. (2020), Height–diameter allometry for the management of city trees in the tropics. Environmental Research Letters, 15, 114017. https://doi.org/10.1088/1748-9326/abbbad
Installation
# Install development version from GitHub
devtools::install_github("xp-song/allometree")Examples
Allometric equations in this package have been used to predict relationships between parameters related tree size and structure, such as age, height, trunk diameter, crown height, crown diameter, leaf area, etc. They are foundational to other models that estimate the benefits and hazards associated with trees as they mature and grow in size. See the vignette ‘Get started with allometree’ for a full description of example datasets and allometric equations.
Let’s develop models to predict tree height from trunk diameter for five species in our example dataset data(urbantrees):
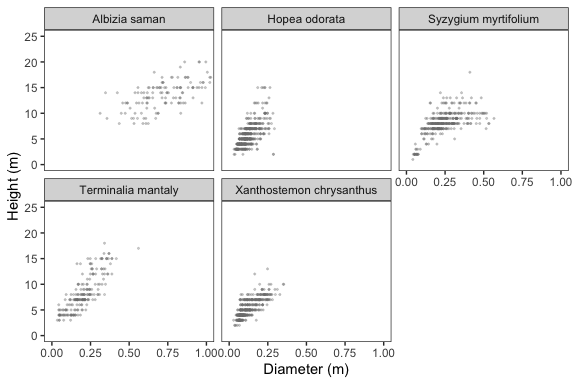
Single-species models
One method is to develop allometric models separately for each species (single-species models). We can select the best-fit equation for each species in the dataset, or fit data to specified (i.e. pre-defined) equations, for example, after the removal of outliers. The example below selects the best-fit equation for each species in urbantrees:
results <- ss_modelselect_multi(urbantrees,
                                species = "species", # specify colname of species
                                response = "height", predictor = "diameter") # specify colnames of variables
We can simulate data across a range of diameter sizes for each species, and use their respective models to make predictions of tree height. The simulated data can also be extrapolated beyond the range used to fit the model. In this example, we specify that predictions should be made between the range 0 to 1 metre:
predictions_ss <- ss_simulate(ref_table = results$ss_models_info,
                              models = results$ss_models,
                              extrapolate = c(0,1))
Mixed-effects model
Alternatively, the full dataset can be fit to a linear mixed-effects model with ‘species’ specified as the random effect, using the lme4::lmer function under the hood:
results <- mix_modelselect(urbantrees,
                           species = "species",
                           response = "height", predictor = "diameter")
Simulations can likewise be performed across a range of diameter sizes for each species, and extrapolated beyond the range used to fit the model:
predictions_mix <- mix_simulate(data = urbantrees,
                                modelselect = results,
                                extrapolate = c(0, 1))
Visualisations
Model predictions can be visualised alongside the original data using ggplot2::ggplot():
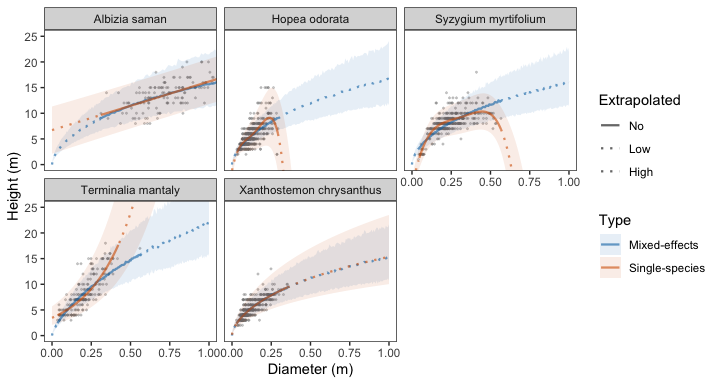
These allometric relationships can then be interpreted according to the types of variables modelled, and in conjunction with information on the biology and growth (e.g. environmental and management) conditions associated with the trees.